Data on the First Few Days of Early Voting in Virginia
Or: Why no one can actually tell you what's happening based on early voting data

I’ve seen a few articles in the news suggesting that VA’s early voting data from Virginia Public Access Project (VPAP) suggests that conservatives are taking an early lead - this seems an obvious conclusion when you look at the number of ballots cast relative to VPAP’s partisan lean index. But when you look into the data, it’s not that clear.
Before we get into the data there’s a few things to clarify - trying to read election performance based on past lean of the districts is somewhat difficult. VPAP calculates their lean index for the House of Delegates based on the 2021 Gubernatorial results and the 2024 Presidential results. This results in a few estimates that are very obviously incorrect - for example there are several districts that are listed as “leans dem” that actually have the dem candidate running unopposed for HOD. Another obvious mistake to make in predicting what the data means is assuming that every single person is voting down ballot for the same party. That’s a flaw I’m going to have in my data as well. Of course, in a district that voted 95% for an unopposed democratic HOD delegate, a smaller percent may vote for the democratic governor candidate.
Let’s first look at VPAP’s lean index and compare it to the 2023 House of Delegates election results.
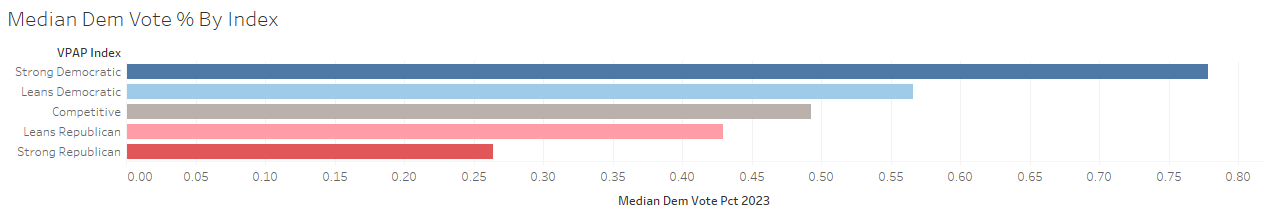
There’s a few interesting things here. “Strong Democratic” district’s median vote split in 2023 was 78% of votes going to Dems, while “Strong Republican” districts still contributed 26% of their votes to Dems. So in “Strong Republican” districts, they contribute somewhat more of their votes towards the opposite party than in “Strong Democratic” districts.
That split disappears on the “Lean” districts though, which are 56% and 43% voting in favor of the Dems. And the competitive districts slightly disfavored the Dems at 49%.
Again though, this is reading the tea leaves. It’s difficult to predict exactly what voters will do in 2025, and looking at data on what voters did from 2021, 2023, or 2024 isn’t necessarily a great predictor of what voters will do in the future. That being said, Spanberger is polling quite a lot higher than McAuliffe was, so using 2023 data probably gives a better idea than 2021 data.
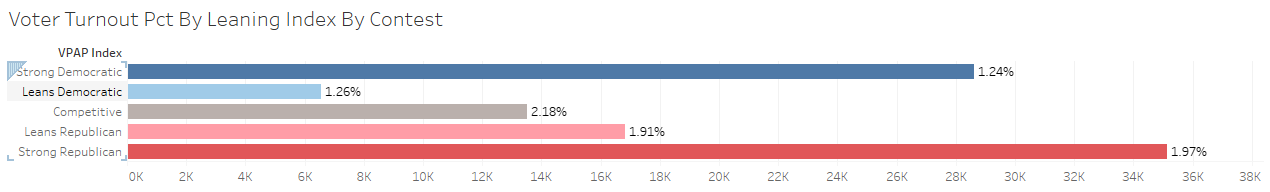
So lets look just at the ballots cast using the VPAP index data. It shows that Dems are slightly behind in early voter turnout. This is where news articles saying that there is an early lead for republicans are coming from.
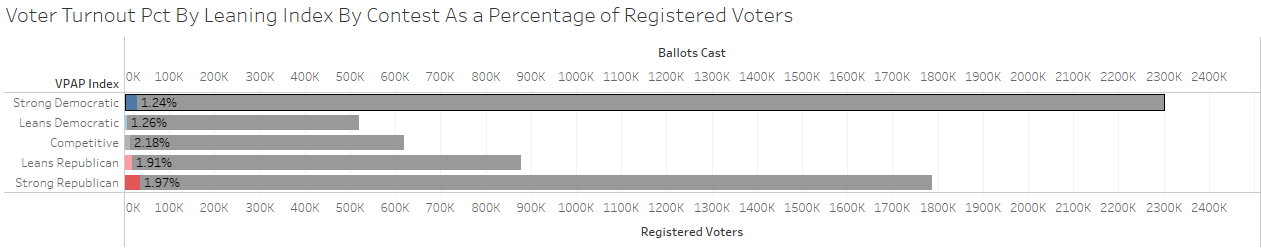
However let’s break down this data in a very detailed way. For each district, we will look at the 2023 vote split percentage and calculate an estimated number of votes for each party by multiplying the number of ballots cast so far by the percentage of votes going to either party. Then, we can use the sum of votes by district to get a more accurate idea of how the votes may actually look.
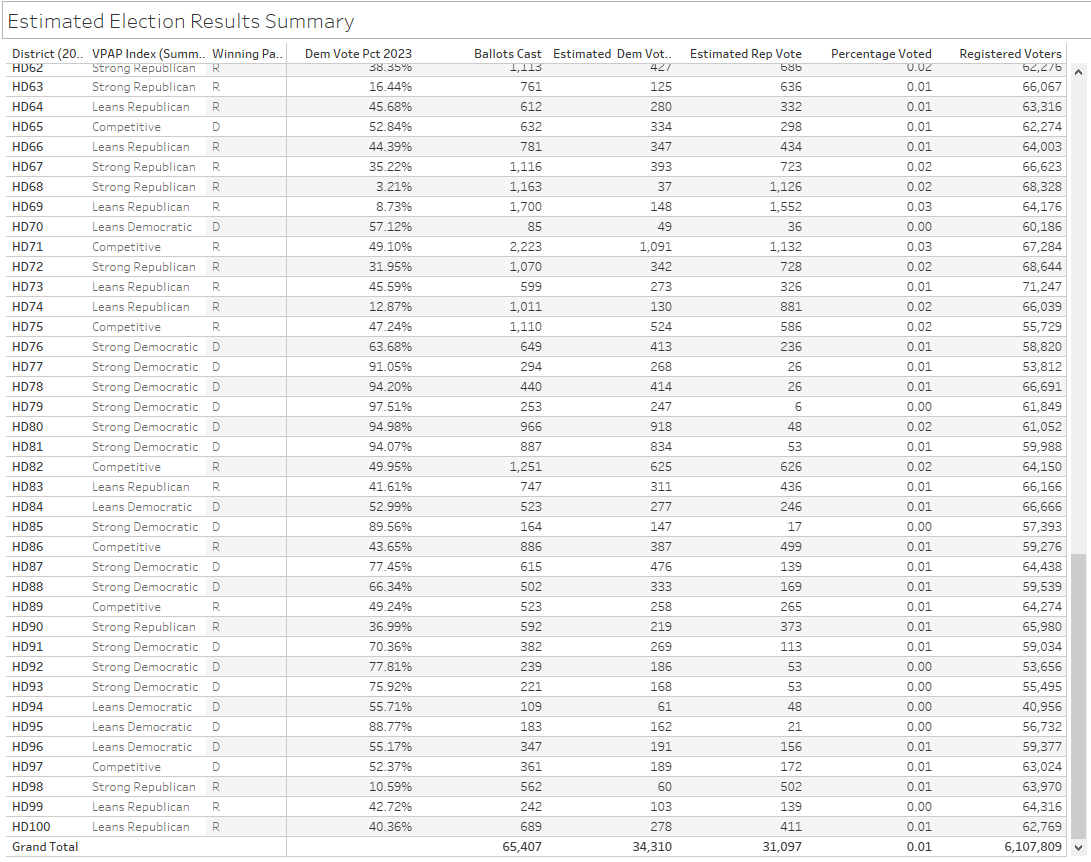
Using historical data to estimate the vote split for each district, this allows us to see that there is an estimated 34310 votes for Dems, and 31097 votes for Republicans, an ~2.45% lean in favor of the Dems. But this data is still not very reliable. You’ll note that only 1% of ballots have been cast as of 09/23/2025. Even if this estimate was 100% accurate today, there are many reasons that the first week or so of early voting may be skewed one way or the other. For one, early voting from M-F is going to be geared more heavily towards people who are retired or who do not work M-F, 9-5 jobs. So using the voting data of the general population to make estimates about what is happening with only a very tiny fraction of the total votes in so far is never going to generate an accurate result. So in general, you should be wary of any person or news outlet who is telling you that that the early ballot info so far has any real meaning or indication of what is going on with the election.